Data, Statistics & Visualization

DataViz Makeover 3
Visualization of covid-19 epidemic situation in DKI Jakarta, Indonesia, June 2021

Crime Analysis: Kronos Incident
Using R to complete the text analysis, geographic analysis and visualizaiton required by IEEE VAST 2021 Challenge: mini challenge 3

DataViz Makeover 2
Describe the merchandise trade performance with 10 major trading partners from 2011 to 2020.
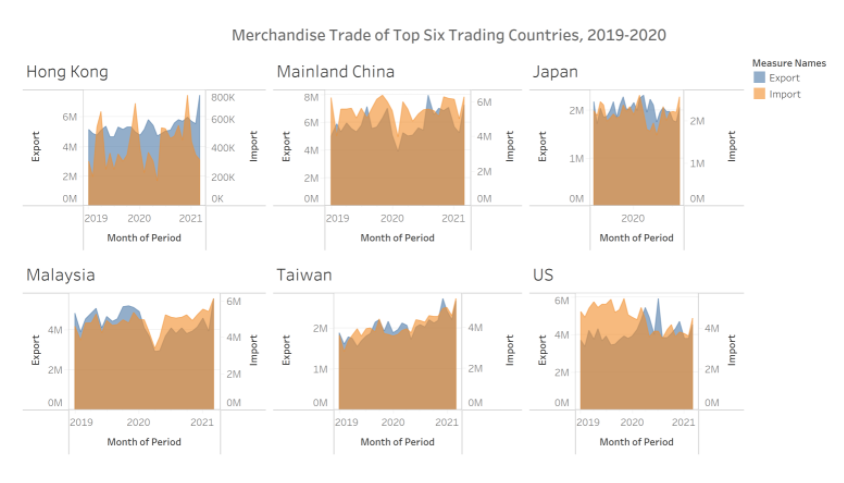
DataViz Makeover 1
Visualization Makeover on Merchandise Trade Data (2019-2020) of Singapore in Tableau